Amazon QuickSight Terms and Concepts
For complete Amazon QuickSight documentation, please always refer to AWS's official Amazon QuickSight documentation here: Amazon QuickSight User Guide.
The section below is provided for those very new to Amazon QuickSight, to help introduce some key Amazon QuickSight concepts and terminology to help you get started. For complete information on the subjects below, please refer to the official Amazon QuickSight documentation (linked above).
The Four key Objects / Entities in Amazon QuickSight terminology:
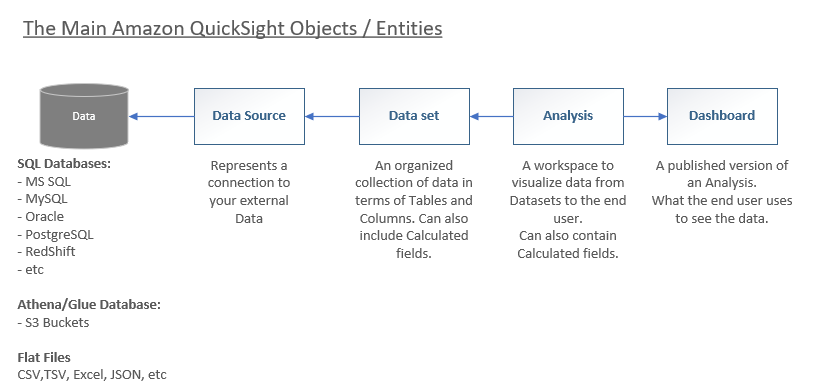
Data Source
A Data Source in Amazon QuickSight represents a connection to your back-end / external data. The external data might be an SQL database, or an Athena/Glue representation of data, or even flat files (like CSV, TSV, Excel, etc.).
Data set (or dataset)
A Data set in Amazon QuickSight is a tabular representation (tables, rows, and columns) of the data retrieved via a Data Source, that can then be used in Analysis's (see below). Each row corresponds to a given record, and each column (or field) of a table represents a particular value or each row or record.
A data set can simply correspond directly to a single table sourced from an external database (or data source), or can be more complex and represent joining together multiple external tables, and/or subsets of those tables.
Additionally, a Data set can also augment the backend data it is sourced from, by adding Calculated Fields that derive further information based on the data represented in the data source.
Analysis
An Analysis in Amazon QuickSight is the fundamental workspace for creating the views over your data that are used by end business users. In Amazon QuickSight, an analysis is the same thing as a dashboard, except it can only be accessed and modified by the authors. When and if you decide to publish an Analysis to end users (non-authors), the shared version of the analysis is called a Dashboard.
The structure of an Analysis is somewhat similar to Excel or a spreadsheet type product, where you have a workbook made up of worksheets (tabs). In Amazon QuickSight an Analysis is made up of tabbed Sheets (or pages). Each sheet contains graphical representations of data sourced from Data sets. These graphical representations are referred to as Visuals and/or Visualizations in Amazon QuickSight.
An analysis can contain a single or multiple sheets, and when published as a Dashboard, the published version can contain a single sheet from the analysis, a subset of the sheets, or all the sheets.
Each sheet can contain multiple visualizations, each backed from different Data sets (a single Visualization can only be sourced from a single data set).
A visual can take many forms - it could visualize the data as table-based rows/columns with groupings, headers and totals; it could be a Pivot table; or it could a chart (such as a line chart, bar chart, pie chart, etc.). For a complete list of visual types, refer to the Amazon QuickSight documentation here: Visual types in Amazon QuickSight.
Dashboard
A Dashboard in Amazon QuickSight is the published version of an Analysis, and is the means of sharing your Analysis with your end business users. Once your dashboard has been published (from an Analysis), it can be shared with other users in Amazon QuickSight for reporting purposes. You specify who has access and what they can do with the dashboard.
A Dashboard can be "saved as" a new Analysis (if you have permissions to do so). Therefore you can go-backwards from a dashboard, back to a new analysis, make changes/additions/deletions, and then re-publish that new analysis as a new dashboard.
Ownership of Objects / Entities
In Amazon QuickSight, all the object types listed in the previous section have an Owner. An owner is an Amazon QuickSight User.
When you first create/configure any one of the object types listed in the previous section, you are the initial owner, and nobody else can see your objects.
If you want other users to be able to see the objects you own, you share them (with other users). When you share an object you can give the target user you are sharing the object with, either read-only permission, or ownership permissions. Once an object is shared with another user with ownership permissions, the object then technically has multiple owners.
Each object can be shared with each other user one-by-one, although that can become cumbersome with many objects and users. Amazon QuickSight provides some additional entities that help manage object sharing an ownership:
- User Groups - a way to gather/collect a set of users together into a group. A user can be a member of multiple User Groups. You can then share an object with a User Group rather than an individual user (or do both).
- Shared Folders - a way to organize/share a set of objects together. A Shared folder (containing multiple objects) can then be shared with individual users, user groups, or both.
Spice
Another term you will hear often with Amazon QuickSight is the term SPICE. SPICE is an acronym, and stands for: Super-fast, Parallel, In-memory Calculation Engine.
SPICE (Super-fast, Parallel, In-memory Calculation Engine) is the robust in-memory engine that Amazon QuickSight uses. It's engineered to rapidly perform advanced calculations and serve data. In Enterprise edition, data stored in SPICE is encrypted at rest.
Spice is essentially Amazon QuickSight's implementation of a Cache.
When you create a Data set, the data set can be configured to be either a Direct Query or a Spice data set.
When a Direct Query data set is used (for example, as a Visual on a Sheet as part of an Analysis, that's published as a Dashboard), every time the visual is shown (to each user) and the data set is therefore accessed, the data set performs a direct query to the backend data source to retrieve a new copy of the data/results.
Alternatively you can import data into a data set (configured as a Spice dataset) rather than using a direct SQL query, and that data becomes SPICE data because of how it's stored.
When a Spice data set is used, every time the visual is shown (to each user) and the data set is therefore accessed, the data is served from the SPICE cache rather than performing a direct query to the backend data source to retrieve a new copy of the data/results. Therefore all users "share" the same copy of data cached in Spice. The huge gain is performance and scalability.